XAIoGraphs
![]()
![]()
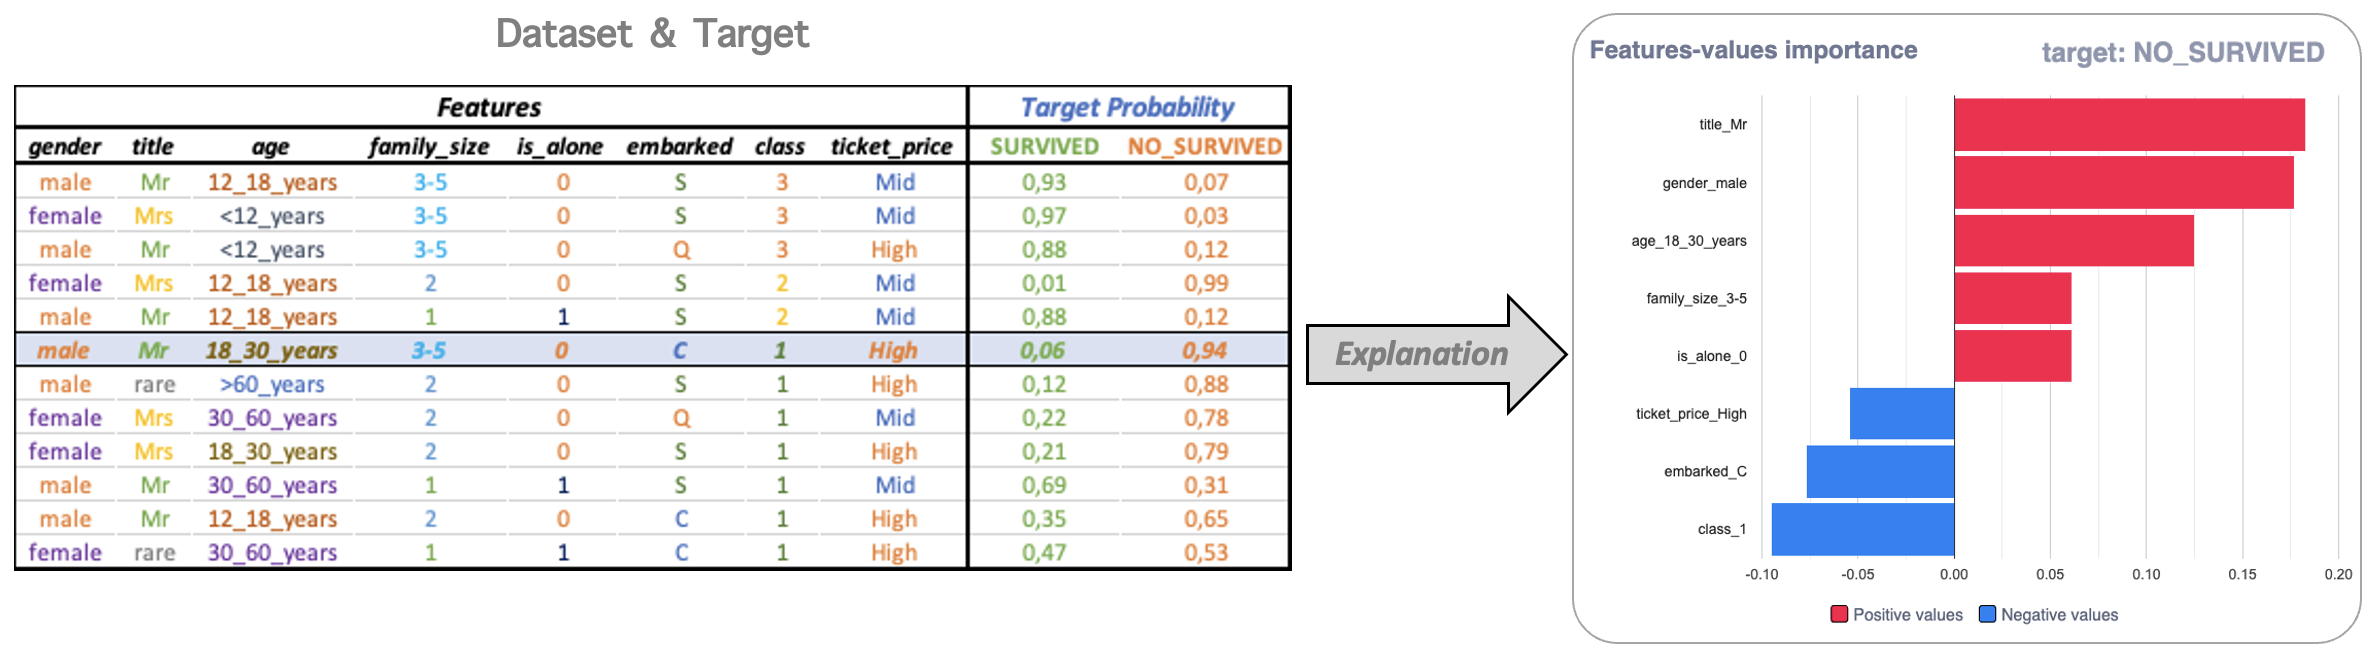
XAIoGraphs (eXplainability Articicial Intelligence over Graphs) is an Explicability and Fairness Python library for classification problems with tabulated and discretized data.
The explainability methods in this library don’t make any hypotheses about the data, so it does not require the AI model. Simply need data and predictions (or decisions), being able to explain AI models, rule models, and reality.
This library includes the following functionalities:
Global Explainability: Explains predictions or decisions as a whole, focusing on the variables that have the most influence.
Local Explainability: Explains the prediction of a single element.
Reliability Measure of local explainability.
Reason Why: explanation in natural language of the classification of each element.
Fairness Scoring: highlights potential discriminations in classifications based on sensitive features.
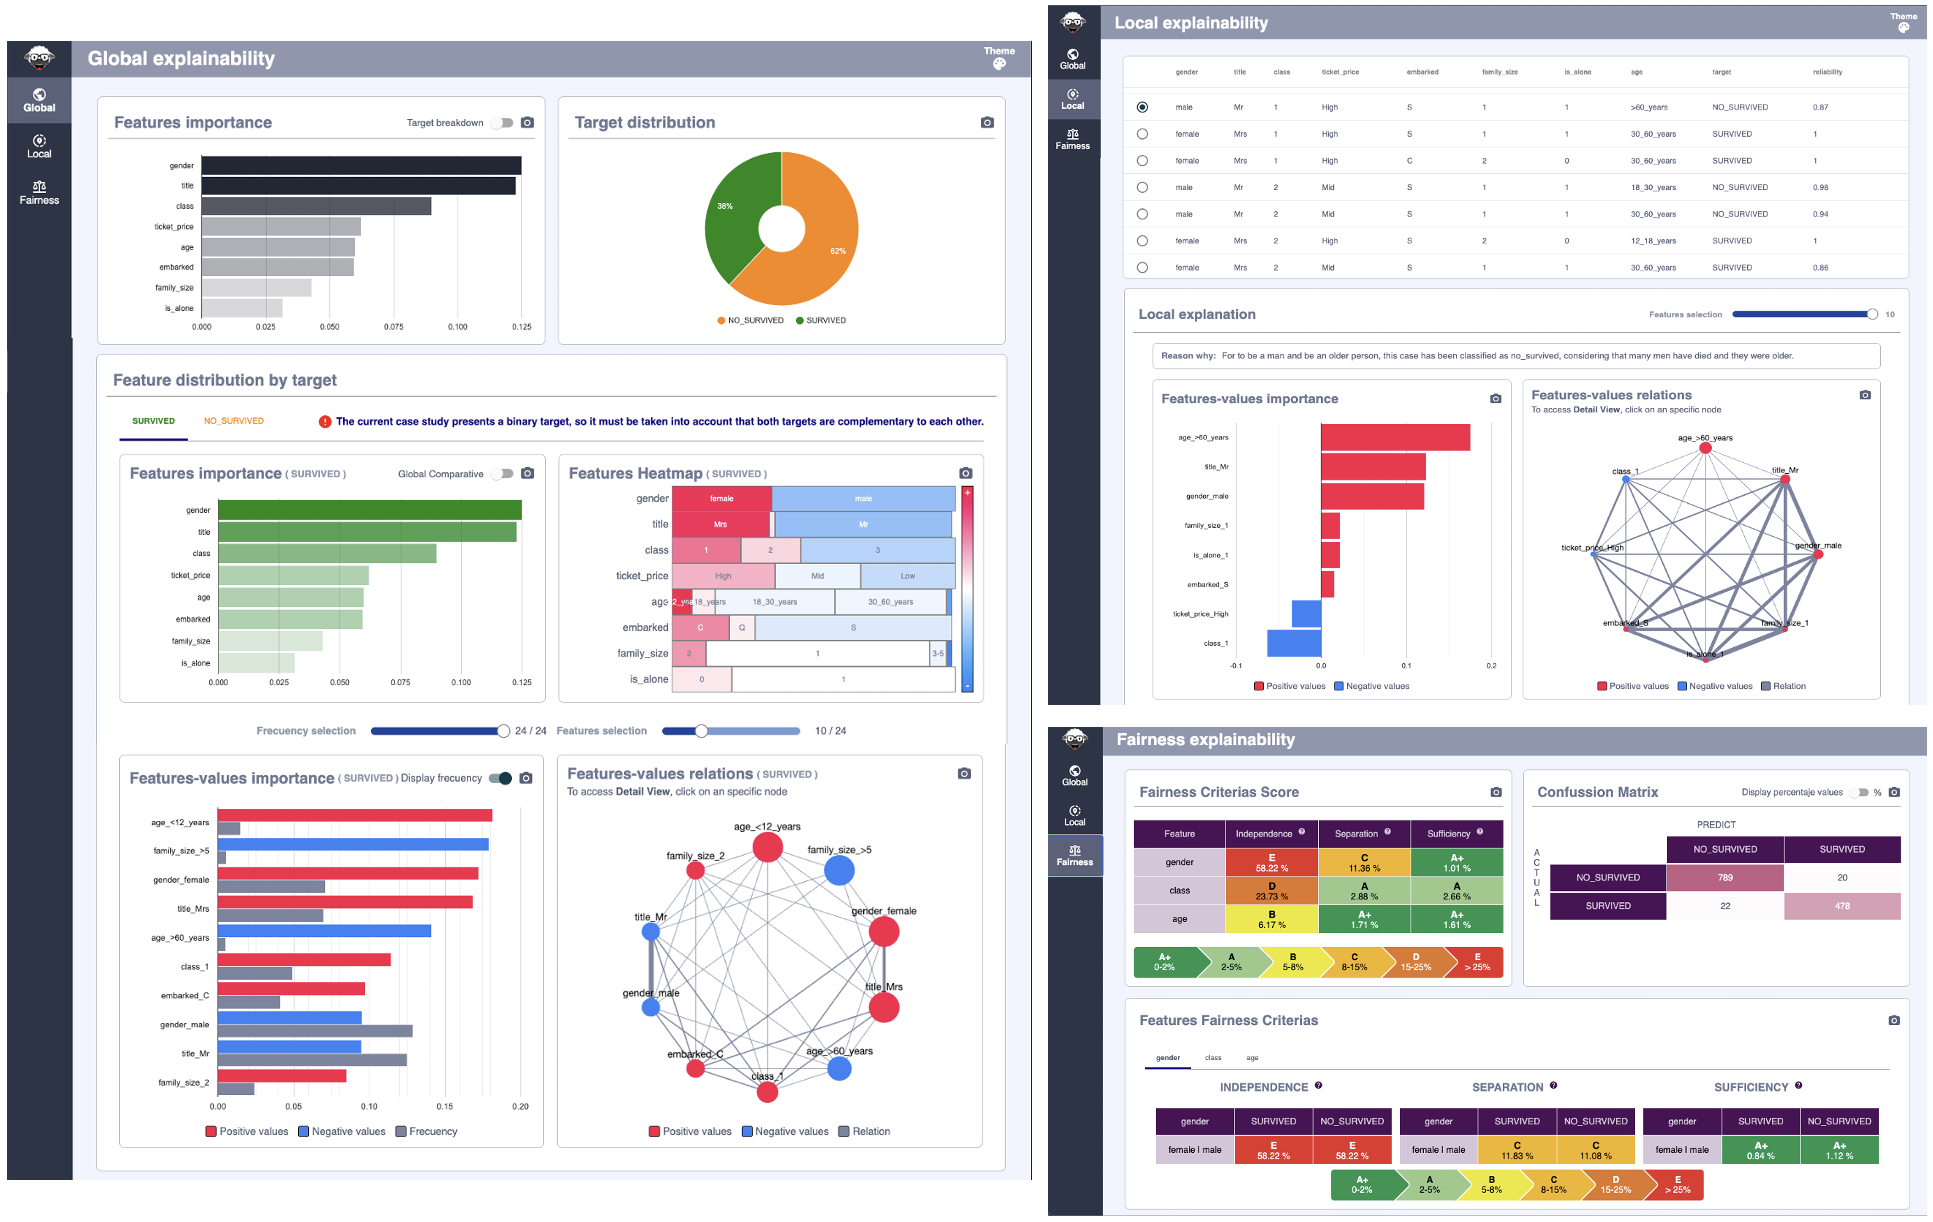
To understand or interpret the explanations uses XAIoWeb, a web interface running in local mode (127.0.0.1:8080). It displays the explanations outcomes in three sections: Global, Local and Fairness.
🚀 Quickstart
Installation 🔨
Create a virtual environment using conda for easier management of dependencies and packages. For installing conda, follow the instructions on the official conda website
>> conda create --name env_xaio python=3.10
>> conda activate env_xaio
Warning
Use a python version 3.10 or higher
XAIoGraphs can be installed from PyPI
>> pip install xaiographs
Start with your first example 📝
Use the following entry point to view an example run with the virtual environment enabled:
>> titanic_example
Alternatively, you may run the code below to view a full implementation of all XAIoGraphs functionalities:
from xaiographs import Explainer
from xaiographs import Why
from xaiographs import Fairness
from xaiographs.datasets import load_titanic_discretized, load_titanic_why

LANG = 'en'

# LOAD DATASETS & SEMANTICS
df_titanic, feature_cols, target_cols, y_true, y_predict = load_titanic_discretized()
df_values_semantics, df_target_values_semantics = load_titanic_why(language=LANG)

# EXPLAINER
explainer = Explainer(importance_engine='LIDE', verbose=1)
explainer.fit(df=df_titanic, feature_cols=feature_cols, target_cols=target_cols)

# WHY
why = Why(language=LANG,
          explainer=explainer,
          why_values_semantics=df_values_semantics,
          why_target_values_semantics=df_target_values_semantics,
          verbose=1)
why.fit()

# FAIRNESS
f = Fairness(verbose=1)
f.fit(df=df_titanic[feature_cols + [y_true] + [y_predict]],
      sensitive_cols=['gender', 'class', 'age'],
      target_col=y_true,
      predict_col=y_predict)
Following execution, a folder called “xaioweb files” is created, which contains a set of ‘.json’ files that will be used to present the results in the XAIoWeb graphical interface.
Launching XAIoWeb 📊
XAIoWeb is a local web interface that displays the outcomes of the explanations in three sections: Global, Local, and Fairness. To launch the web (with the virtual environment enabled), run the following entry point:
>> xaioweb -d xaioweb_files -o
This entry point takes the following parameters:
-do--data[REQUIRED]: JSON files path-po--port[OPTIONAL]: Web server port. 8080 by default-oo--open[OPTIONAL]: Open web in browser-fo--force[OPTIONAL]: Force building the web from scratch, overwriting the existing one
🤝 Contributors
XAIoGraphs has been developed by Applied AI & Privacy team (Telefónica Innovación Digital - Chief Data Officer)