Titanic Example
In this example, we use the Titanic Dataset, which describes the survival status
of individual Titanic passengers.
This dataset can be obtained using the load_titanic() function:
>>> from xaiographs.datasets import load_titanic
>>> df_dataset = load_titanic()
>>> df_dataset.head(3)
    id  gender title      age  family_size  is_alone embarked  class  ticket_price  survived
0    0  female   Mrs  29.0000            0         1        S      1      211.3375         1
1    1    male    Mr   0.9167            3         0        S      1      151.5500         1
2    2  female   Mrs   2.0000            3         0        S      1      151.5500         0
Note
Documentation of the characteristics of Titanic Dataset
Titanic Explainer
To determine the explainability of this dataset, we have discretized the continuous features (age, family_size
and ticket_price) and produced as many columns representing the probability of the target as there are targets in
the dataset.In this example, we will have two columns with probabilities of 0 and 1: SURVIVED and NO_SURVIVED.
The function load_titanic_discretized()
in XAIoGraphs already provides this altered dataset.
>>> from xaiographs.datasets import load_titanic_discretized
>>> df_dataset, features_cols, target_cols, _, _ = load_titanic_discretized()
>>> df_dataset[features_cols + target_cols].head(3)
   id  gender title          age family_size  is_alone embarked  class ticket_price  SURVIVED NO_SURVIVED
0   0  female   Mrs  18_30_years           1         1        S      1         High         1           0
1   1    male    Mr    <12_years         3-5         0        S      1         High         1           0
2   2  female   Mrs    <12_years         3-5         0        S      1         High         0           1
Hint
This example demonstrates the true target (y_true). If you wanted to explain a Deep|Machine Learning model’s
predictions, you would have to create the SURVIVED and NO_SURVIVED columns with the model prediction results
(y_predict) rather than reality.
To obtain different explainability results, we must create an object of class Explainer
and analyze it through the dataset and the explainability engine (LIDE). Later, by using the fit() method and
handing it a list containing the names of the feature columns (feature_cols) and another list containing the names
of the target columns (target_cols), it will execute all of the computations required to provide the explainability:
>>> explainer = Explainer(importance_engine='LIDE', verbose=1)
>>> explainer.fit(df=df_dataset, feature_cols=features_cols, target_cols=target_cols)
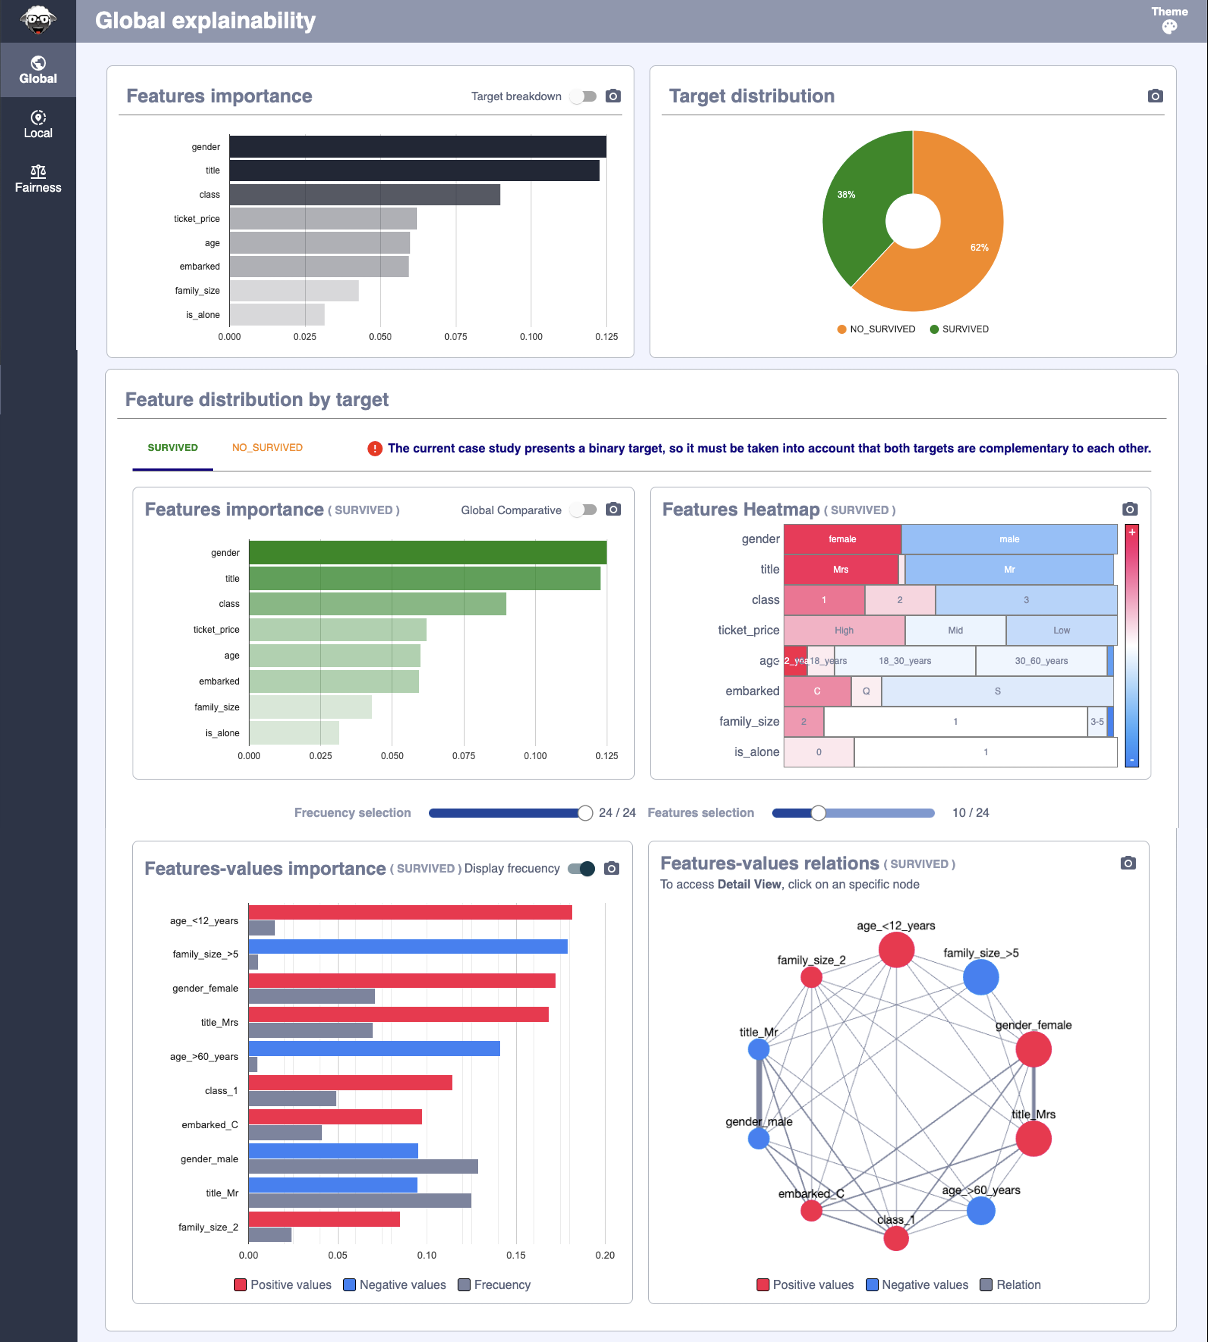
We retrieve the explainability results by accessing the various characteristics of the
Explainer class. Let us now look at how we would calculate the relevance of the features:
>>> explainer.global_explainability
        feature  importance  rank
0        gender    0.124936     1
1         title    0.122790     2
2         class    0.089931     3
3  ticket_price    0.062145     4
7           age    0.059930     5
4      embarked    0.059490     6
5   family_size    0.042980     7
6      is_alone    0.031692     8
The explainability information supplied by the rest of the class’s attributes may be found in the documentation for
the Explainer class.
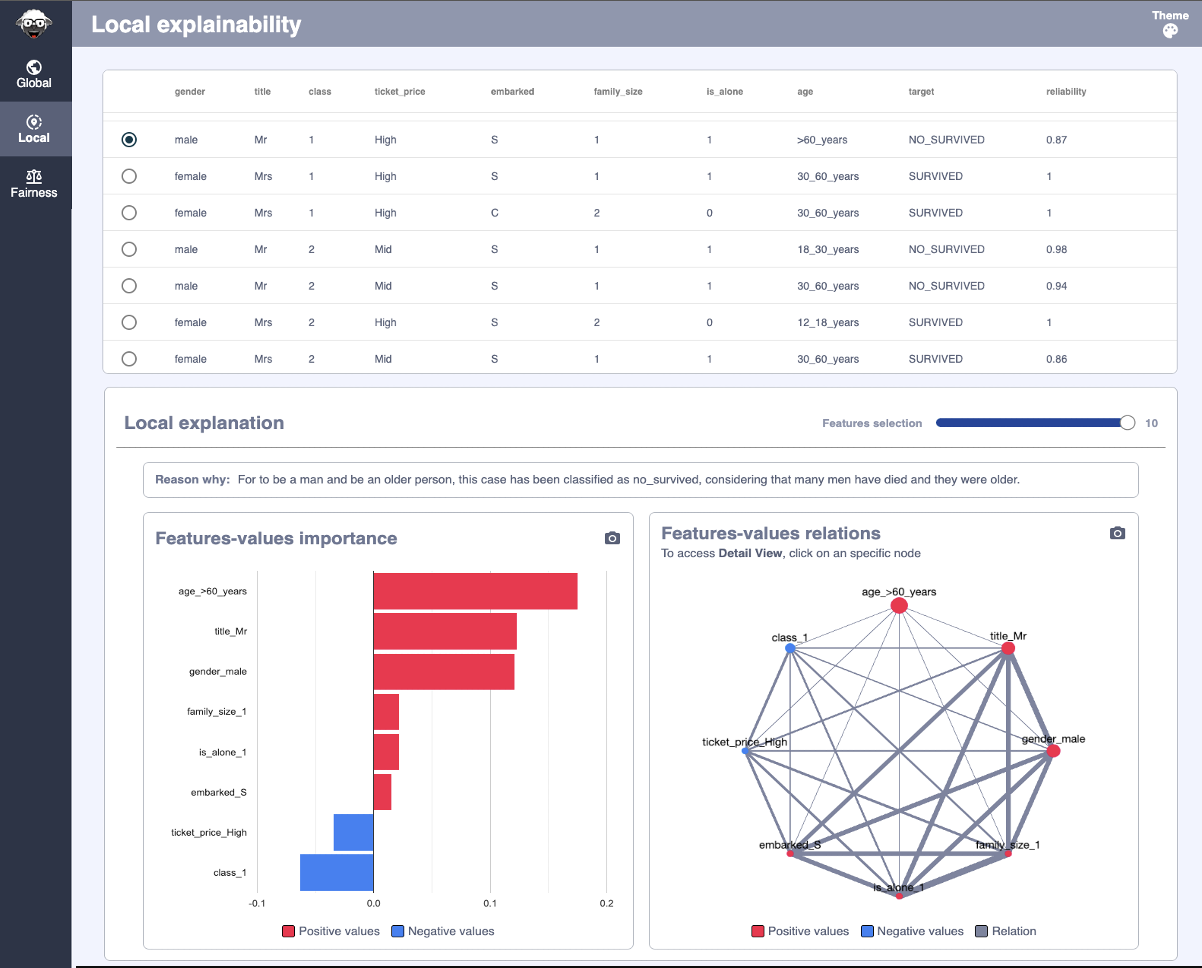
Titanic Reason Why
To compose a natural language phrase that describes Reason Why an element was categorized in a specific class,
you’ll need (using the Why class):
Importance value of each Feature-Value for each dataset element
Template for Natural Language Sentences
Global and local semantics that assign a description to each Feature-Value
Let’s look at how to build the Reason Why for the following element:
   id  gender title          age family_size  is_alone embarked  class ticket_price  SURVIVED NO_SURVIVED
0   0  female   Mrs  18_30_years           1         1        S      1         High         1           0
After running
Explainer, we obtain the importance values of each element (in this case, only the first element):
>>> explainer.local_feature_value_explainability[explainer.local_feature_value_explainability.id==0].sort_values('rank')
   id      feature_value  importance  rank
0   0      gender_female    0.191029     1
1   0          title_Mrs    0.189320     2
2   0            class_1    0.147101     3
3   0  ticket_price_High    0.101550     4
7   0    age_18_30_years    0.008612     5
5   0      family_size_1    0.004920     6
6   0         is_alone_1    0.004920     6
4   0         embarked_S   -0.027895     8
We define a sentence template that has three elements:
$target: It will be replaced by the class name to which the element belongs. (SURVIVEDorNO_SURVIVED)$temp_values_explain: It will be replaced by a semantics that describes each Feature-Value.$temp_target_values_explain: It will be replaced with a semantics that explains each Feature-Value in relation to the target.
For $temp_values_explain, this case has been classified as $target, considering that $temp_target_values_explain.
Two semantics that associate a brief description with each Feature-Value must be defined. One of those semantics will be used to complete the template’s
$temp_target_values_explainsentence component, while the other semantics will be used to complete the template’s$temp_values_explainsentence part.
Depending on the target, the first semantics assigns a descriptive word to each Feature-Value:
target |
feature_value |
reason |
|---|---|---|
NO_SURVIVED |
gender_male |
many men have died |
NO_SURVIVED |
gender_female |
to be a woman |
NO_SURVIVED |
is_alone_1 |
they traveled alone |
… |
… |
… |
NO_SURVIVED |
age_18_30_years |
they were young |
NO_SURVIVED |
class_1 |
few traveled in 1st class |
NO_SURVIVED |
ticket_price_High |
they paid a lot for the ticket |
NO_SURVIVED |
embarked_S |
many boarded at Southampton |
… |
… |
… |
SURVIVED |
gender_female |
many women survived |
SURVIVED |
is_alone_1 |
they traveled alone |
SURVIVED |
age_18_30_years |
they were young |
SURVIVED |
class_1 |
many traveled in 1st class |
SURVIVED |
ticket_price_High |
they paid a lot for the ticket |
SURVIVED |
embarked_S |
few boarded at Southampton |
Second, assign a descriptive phrase to each Feature-Value:
feature_value |
reason |
|---|---|
gender_male |
to be a man |
gender_female |
to be a woman |
is_alone_1 |
travel alone |
… |
.. |
age_18_30_years |
be young |
class_1 |
travel in 1st class |
ticket_price_High |
pay too much for the ticket |
embarked_S |
embark in a lower class town |
Warning
Only a sampling of the Feature-Value that interest us for the example has been shown, not the entire semantics.
For each problem, these semantics must be defined. XAIoGraphs includes the templates and semantics for this dataset
via load_titanic_why() function.
df_values_semantics, df_target_values_semantics = load_titanic_why(language='en')
We build the natural language sentences of the Reason Why using the class Why and
calling the method fit() after executing the
Explainer and with the templates and semantics defined (in padas.DataFrame):
why = Why(language=LANG,
          explainer=explainer,
          why_values_semantics=df_values_semantics,
          why_target_values_semantics=df_target_values_semantics,
          verbose=1)
why.fit()
We use the why_explanation property to get the
Reason Why sentences for each of the items.
>>> why.why_explanation[why.why_explanation.id==0]
   id  reason
0   0  For to be a woman and travel in 1st class, this case has been classified as survived, considering that many women survived and many traveled in 1st class.
In this example, the Reason Why sentence is created in natural language using the template and semantics.
Hint
The function build_semantic_templates() of
class Why returns two .csv files
(values_semantics.csv and target_values_semantics.csv) containing the Feature-Value pairs required to complete
the semantics.
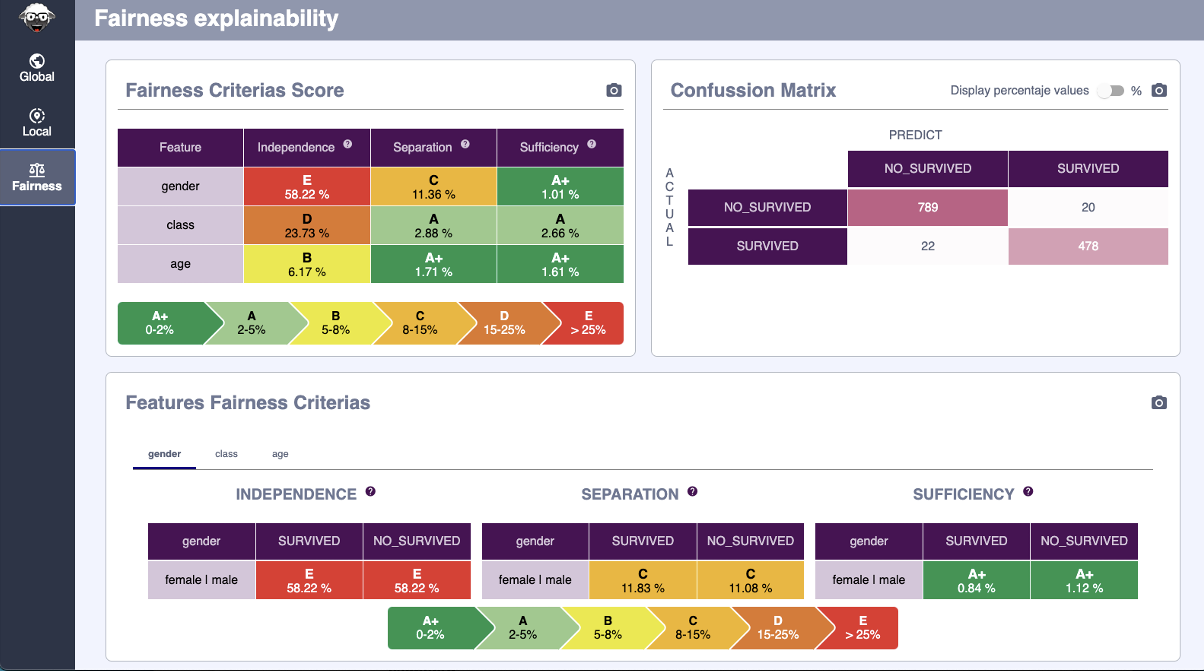
Titanic Fairness
To obtain the Fairness Scores and Categories, a Dataset with the sensitive features discretized and two columns
containing the goal (y_true) and prediction (y_predict) is required. The function load_titanic() in XAIoGraphs
already provides this altered dataset:
>>> from xaiographs.datasets import load_titanic_discretized
>>> df_dataset, features_cols, _, y_true, y_predict = load_titanic_discretized()
>>> df_dataset[features_cols + [y_true] + [y_predict]].head(3)
   gender title          age family_size  is_alone embarked  class ticket_price       y_true    y_predict
0  female   Mrs  18_30_years           1         1        S      1         High     SURVIVED     SURVIVED
1    male    Mr    <12_years         3-5         0        S      1         High     SURVIVED     SURVIVED
2  female   Mrs    <12_years         3-5         0        S      1         High  NO_SURVIVED  NO_SURVIVED
Calling the method fit() and passing dataset
(Pandas Dataframe), a list of sensitive features to be evaluated, and the names of the columns with the target and
prediction as parameters, it will calculate the Independence,
Separation, and
Sufficiency fairness criteria.
>>> from xaiographs import Fairness
>>> f = Fairness()
>>> f.fit(df=df,
...       sensitive_cols=['gender'],
...       target_col='y_true',
...       predict_col='y_predict')
XAIoWeb Titanic
After running the .fit() methods of each of the classes (one, two, or all three), a sequence of JSON files are
generated in the xaioweb_files folder to visualized in XAIoWeb interface.
To launch the web (with the virtual environment enabled), run the following entry point:
>> xaioweb -d xaioweb_files -o
And the results seen in XAIoWeb are the following:
Global Explainability
Local Explainability
Fairness