Education Performance Example#
In this example, we use the Education Performace Dataset. This
dataset was collected from the Faculty of Engineering and Faculty of Educational Sciences students in 2019.
The purpose is to predict students’ end-of-term performances using ML techniques.
This dataset can be obtained using the load_education_performance()
function:
>>> from xaiographs.datasets import load_education_performance
>>> df_dataset = load_education_performance()
>>> df_dataset.head(3)
   id  age  sex  graduated_h_school_type  scholarship_type  additional_work  activity  partner  total_salary  transport  accomodation  mother_ed  farther_ed  siblings  parental_status  mother_occup  father_occup  weekly_study_hours  reading_non_scientific  reading_scientific  attendance_seminars_dep  impact_of_projects  attendances_classes  preparation_midterm_company  preparation_midterm_time  taking_notes  listenning  discussion_improves_interest  flip_classrom  course_id  grade
0  0     2    1                        2                 3                2         2        1             3          4             2          1           2         3                1             2             3                   2                       2                   2                        1                   1                    2                            1                         1             2           2                             2              2          1   Fail
1  1     1    1                        1                 4                1         1        2             4          2             3          4           4         1                1             3             2                   3                       3                   3                        1                   3                    1                            3                         2             3           1                             3              3          1   Fail
2  2     1    1                        1                 4                2         2        2             1          1             1          3           4         4                2             2             2                   3                       2                   2                        1                   1                    1                            1                         1             2           2                             2              3          1   Fail
To determine the explainability of this dataset, XAIoGraphs provides a dataset that has already been discretized and
columns with targets probabilities using
load_education_performance_discretized() function:
>>> from xaiographs.datasets import load_education_performance_discretized
>>> df_dataset, features_cols, target_cols, y_true, y_predict = load_education_performance_discretized()
>>> df_dataset.head(3)
   id   age     sex  graduated_h_school_type  scholarship_type  additional_work  activity  partner  total_salary         transport  accomodation       mother_ed        farther_ed             parental_status             mother_occup             father_occup  weekly_study_hours  reading_non_scientific  reading_scientific  attendance_seminars_dep  impact_of_projects  attendances_classes  preparation_midterm_company       preparation_midterm_time  taking_notes  listenning  discussion_improves_interest    flip_classrom  y_true  y_predict  A  B  C  D  Fail
0  0  22-25  female                    state               50%               No        No      Yes   USD 271-340             Other     dormitory  primary school  secondary school                     married                housewife  private sector employee            <5 hours               Sometimes           Sometimes                      Yes            positive            sometimes                        alone       closest date to the exam     sometimes   sometimes                     sometimes           useful    Fail       Fail  0  0  0  0  1
1  1  18-21  female                  private               75%              Yes       Yes       No   USD 341-410  Private car/taxi   with family      university        university                     married       government officer       government officer          6-10 hours                   Often               Often                      Yes             neutral               always               not applicable  regularly during the semester        always       never                        always   not applicable    Fail       Fail  0  0  0  0  1
2  2  18-21  female                  private               75%               No        No       No   USD 135-200               Bus        rental     high school        university                    divorced                housewife       government officer          6-10 hours               Sometimes           Sometimes                      Yes            positive               always                        alone       closest date to the exam     sometimes   sometimes                     sometimes   not applicable    Fail       Fail  0  0  0  0  1
Code Example#
The following entry point (with Python virtual environment enabled) is used to demonstrate this example.
>> education_performance_example
Alternatively, you may run the code below to view a full implementation of all XAIoGraphs functionalities with this Dataset:
from xaiographs import Explainer
from xaiographs import Fairness
from xaiographs import Why
from xaiographs.datasets import load_education_performance_discretized, load_education_performance_why

LANG = 'en'

# LOAD DATASETS & SEMANTICS
example_dataset, feature_cols, target_cols, y_true, y_predict = load_education_performance_discretized()
df_values_semantics, df_target_values_semantics = load_education_performance_why(language=LANG)

# EXPLAINER
explainer = Explainer(importance_engine='LIDE', number_of_features=13, verbose=1)
explainer.fit(df=example_dataset, feature_cols=feature_cols, target_cols=target_cols)

# WHY
why = Why(language=LANG,
          explainer=explainer,
          why_values_semantics=df_values_semantics,
          why_target_values_semantics=df_target_values_semantics,
          verbose=1)
why.fit()

# FAIRNESS
f = Fairness(verbose=1)
f.fit(df=example_dataset[feature_cols + [y_true] + [y_predict]],
      sensitive_cols=['age', 'sex', 'total_salary', 'accomodation', 'parental_status'],
      target_col=y_true,
      predict_col=y_predict)
XAIoWeb Education Performance#
After running the .fit() methods of each of the classes (one, two, or all three), a sequence of JSON files are
generated in the xaioweb_files folder to visualized in XAIoWeb interface.
To launch the web (with the virtual environment enabled), run the following entry point:
>> xaioweb -d xaioweb_files -o -f
And the results seen in XAIoWeb are the following:
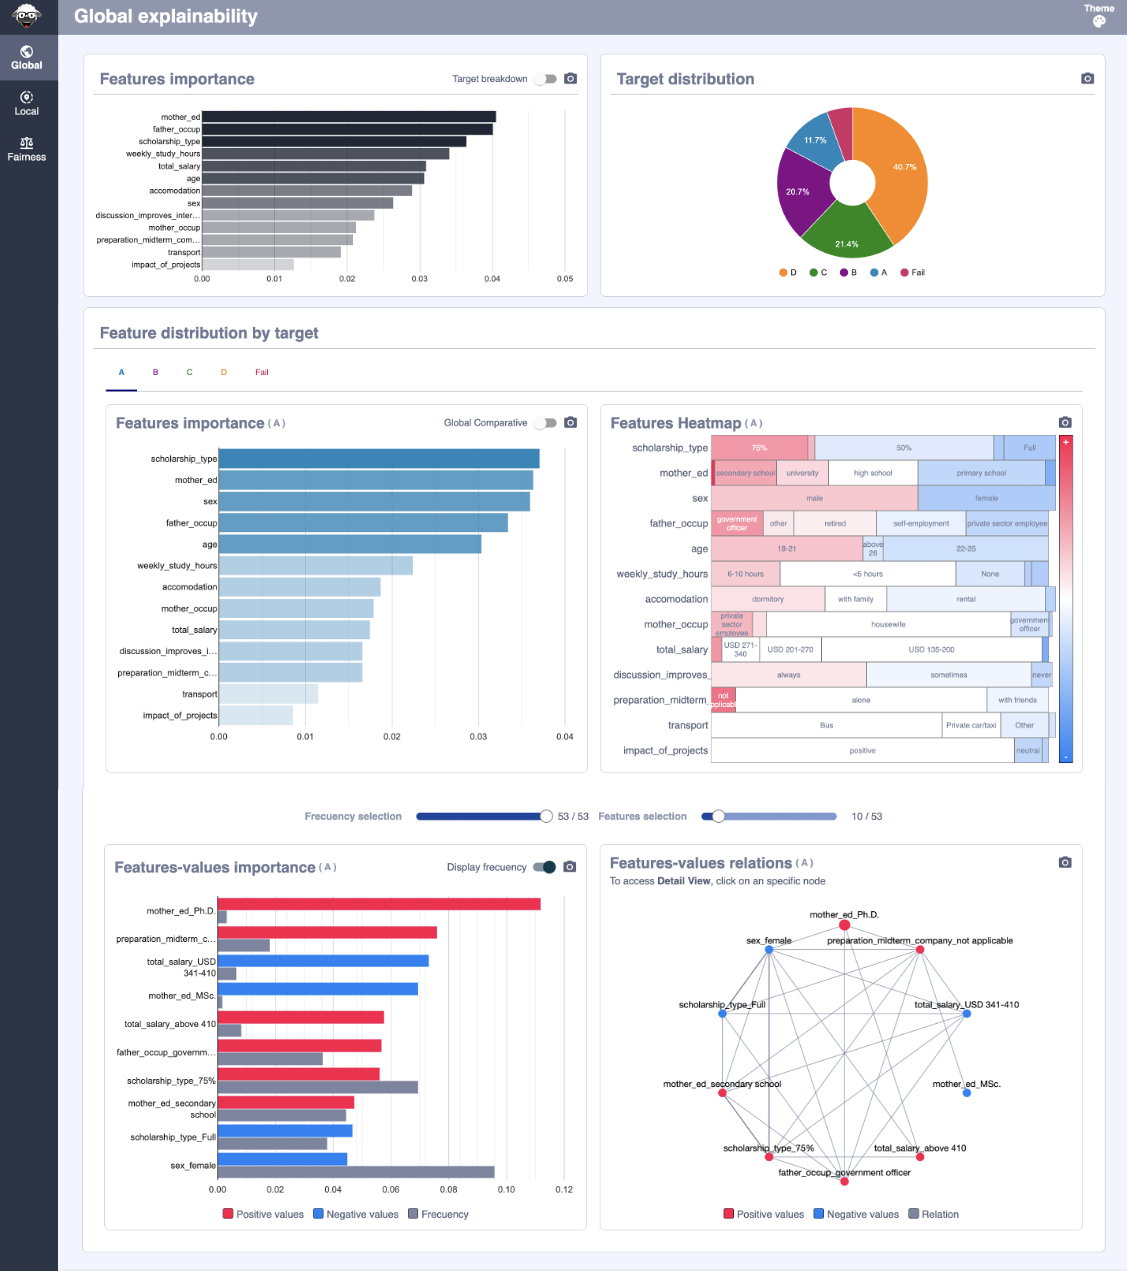
Global Explainability#
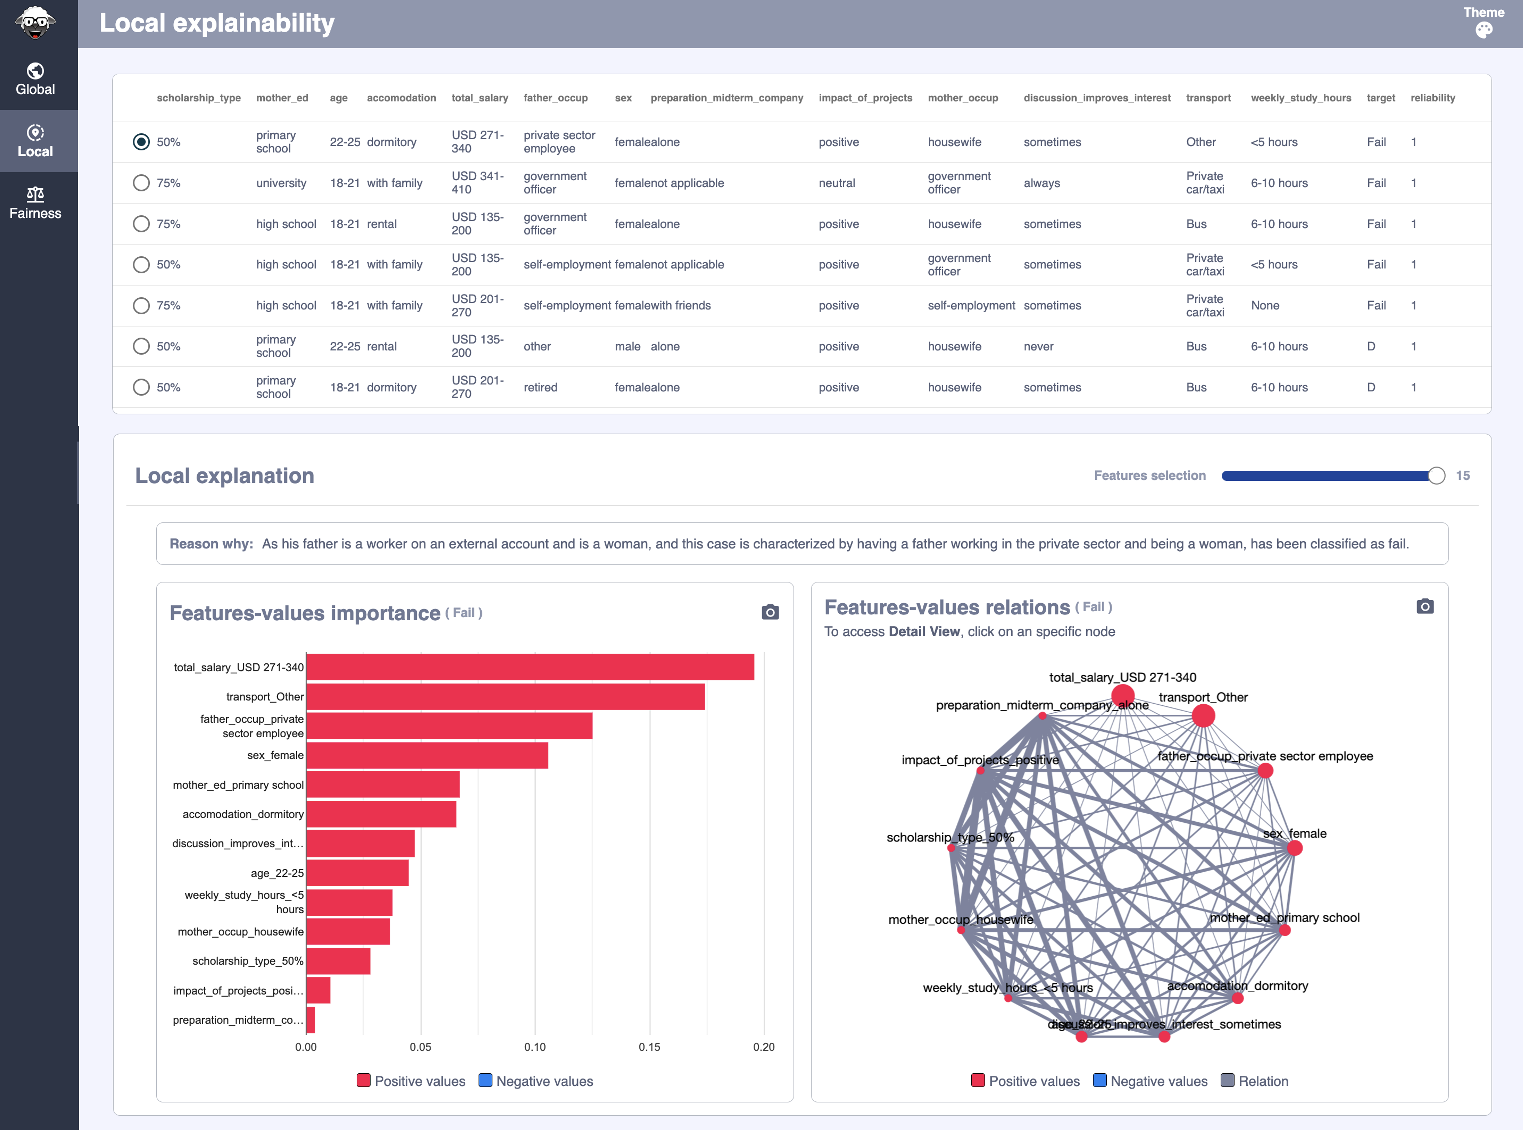
Local Explainability#
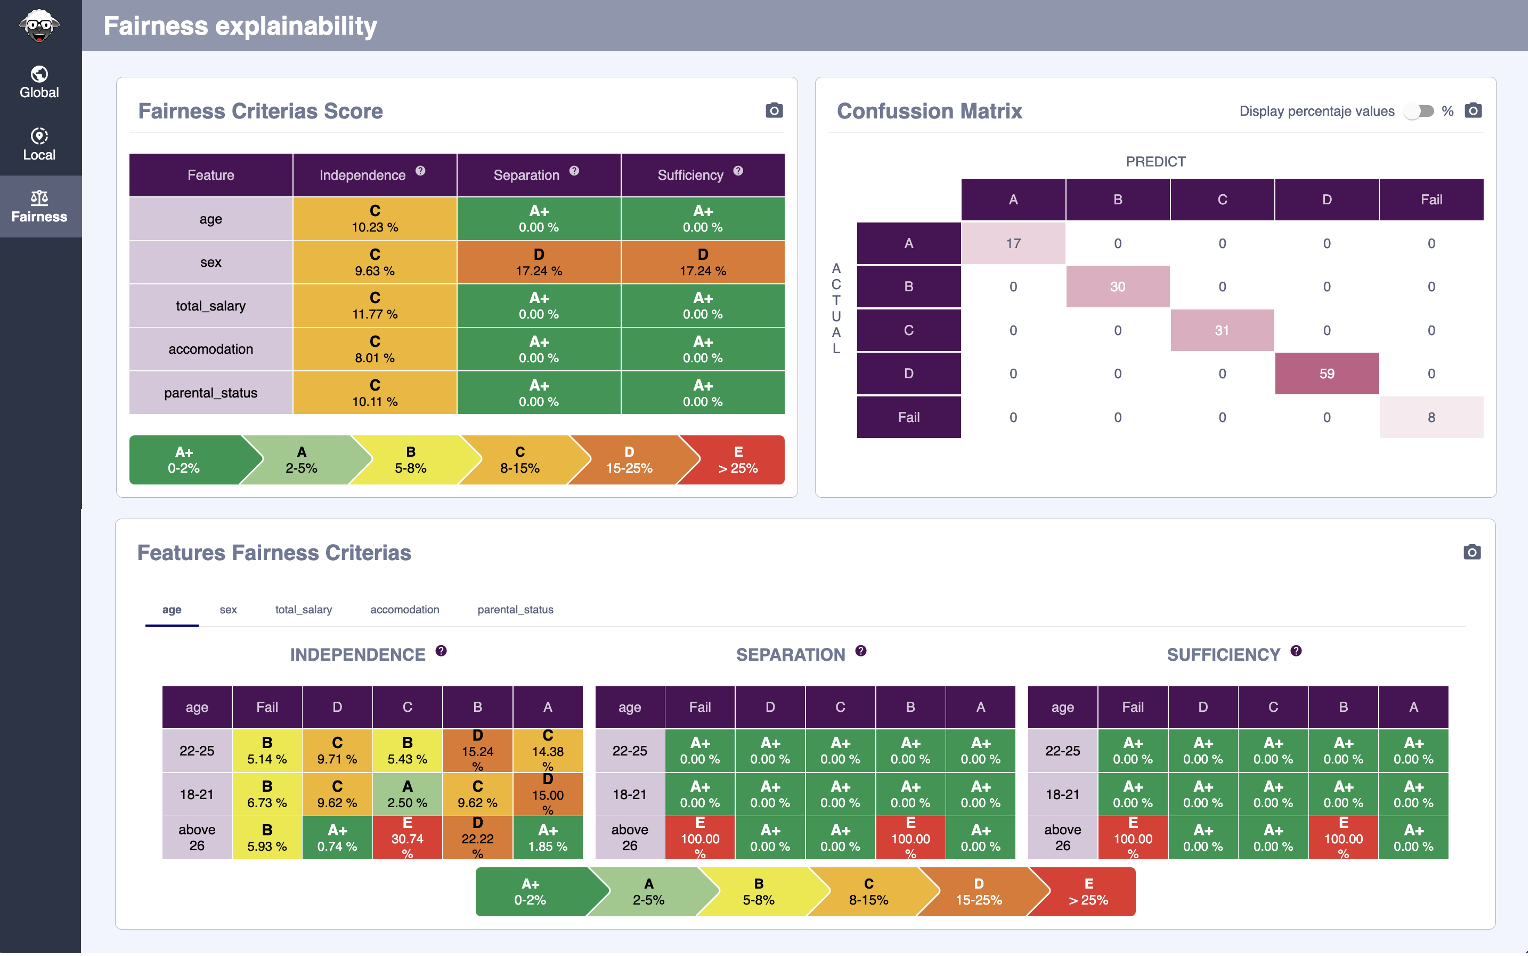
Fairness#